The right data for the right hand setup

Here, the first goal was to get basic sensors readings in general with the next step being to figure out what kind of readings are suitable for controlling effect parameters.

In order to establish which data is needed and how it should be used, the data values of x, y and z and their changes were analyzed while performing strumming movements with the sensor strapped to the hand.

With the IMU +Arduino outputting orientation data, it became clear that the y value could prove useful for controlling effect parameters while strumming the guitar. The range of values of y was analyzed for the up and down strumming movements and the established range subsequently constrained. Then the range was remapped to MIDI values from 0-127 and, using the same data transmission techniques as the left hand setup (so firstly serial bus communication and, subsequently, MIDI), sent to a Pure Data patch similar to the one for the left hand setup.

Next to orientation data, experiments were conducted with accelerometer as well as linear accelerometer data in the same manner.

Using IMU data in Pure Data

In the Pure Data patch, the incoming orientation and (linear) acceleration data was used to control several effects and their parameters. Using the aforementioned “vstplugin~” object, the following effects were tested:

  • MTremolo by Melda Production
  • MPhaser by Melda Production

However, the incoming IMU data proved to be not reasonable for these effects. The linear and normal acceleration data could not be used at all. The orientation data was working to some extent, but no practical application of its effects was immediately discovered.

The first success using the IMU data was the Wah-Wah effect. Using the “vcf~” object, a bandpass filter was made with an adjustable fader going from 280 Hz to 3000 Hz center frequency (the normal operating range of a Wah-Wah pedal) and a Q-factor of 4. Using the y value from the orientation data, the center frequency was controlled through strumming movements of the right hand. The resulting sound was similar to that of a “real” Wah-Wah pedal and could be achieved solely by the natural strumming performed during playing.

The right hand setup

With my left hand setup kind of working I decided to start with my right hand setup which, unfortunately, I have totally neglected so far. Short recap: the right hand setup is planned to consist of an IMU sensor that picks up the natural strumming patterns of the right hand and uses the movement parameters to modulate the guitar sound. First of all, what is an IMU sensor? According to Wikipedia, an inertial measurement unit (IMU) is an electronic device that measures and reports a body’s specific force, angular rate, and sometimes the orientation of the body, using a combination of accelerometers, gyroscopes, and sometimes magnetometers. As the definition suggests, it is quite a complex device and is really on another level coding-wise than the left hand setup featuring the time-of-flight sensor.

At the very beginning of the semester, my supervisor gave me one of his IMU sensors, namely a MPU-92/65. However, as I approached him last week concerning the IMU sensor business for my right hand setup, he recommended me using another kind of IMU sensor, the BNO055 from Bosch. Apparently, there are better/easier-to-use Arduino libraries for the BNO055, and it is capable of sensor fusion – something I will get into below. Luckily, he also had one of those and gave it to me for experimenting.

Additionally, my supervisor told me the basics of IMU sensors which I will relay to you now:

As already mentioned in the definition, an IMU sensor basically combines an accelerometer, a gyroscope and a magnetometer and they can be used alone or in combination to obtain information about the position and/or movement of an object. When used in conjuncture (=sensor fusion), one can determine the pitch, roll and yaw movements of said object which is what I think I need. Since I have to actually wear the sensor on my wrist while playing the guitar, I cannot yet say, what kind of information I need from the IMU sensor. Of course, the pitch, roll and yaw movements make sense, but I could also try acceleration values for example. My goal for now is to get sensors readings in general and in the next step, I will try to figure out what kind of readings work best for my cause.

I found an Arduino library that lets me calculate the orientation of the sensor giving me readings of the x, y and z axes. My supervisor also highlighted the need to calibrate the sensor each time otherwise the readings are inaccurate. Luckily, the library also has a function that reads me the calibration status of each of the sensors in the IMU (accelerometer, gyroscope, magnetometer) – 0 means not calibrated at all; 3 means the sensor is fully calibrated. I watched a YouTube video that explains how to calibrate each of the three sensors: to calibrate the gyro, the sensor just needs to sit still for like 1-2 seconds (easy!). To calibrate the magnetometer, one needs to tilt and move the sensor for a bit into all directions which also works quite well. Calibrating the accelerometer is the most complex of all three approaches. One must tilt the sensor in different angles and hold each position for about five seconds. It takes a little bit of time and experimenting, but it works.

With the calibration and the orientation readings going, I decided to test it by putting the sensor on my wrist – easier said than done! After some tinkering I came up with the very rough solution of using my (seldomly worn) wristwatch and sticking the IMU sensor onto it using double-sided tape. Now I should be able to strap the watch over my hand and start playing.

New Pure Data patch and VST plugins tests

With a new means of communication in place (compare blog #12), a new Pure Data patch was made. After having created custom effects (the delay and the overdrive/distortion effect) for the first Pure Data patch, it was now deemed better to use third-party effect plugins. Luckily, with the help of the object “vstplugin~”, such third-party plugins can be used inside of Pure Data. Furthermore, it is possible to access the plugins’ list of parameters and control them by sending control messages.

The Pure Data patch uses the following three plugins:

  • L12X Solid State Amplifier
  • TAL Dub Delay
  • TAL Reverb 4

The plugins were chosen due to personal constraints: the author is primarily using a desktop PC for audio-related tasks and, hence, most plugins are only available to the author on the desktop PC. As the author’s laptop is used for this project, free plugins were chosen.

At first, a prototype setting for the solo mode was made. Here, the parameter mapping is as follows:

The values coming in from the Arduino are the fret numbers that were calculated from the distance to the ToF sensor in the Arduino sketch. The incoming fret number determines if the amplifier plugin is turned on or off. Using a “moses” object set to the threshold of five, the incoming fret number is compared to the number five. If the fret is below five, the amplifier is or stays turned off. If the fret number is above five, it is turned on. Additionally, fret numbers above five increase the delay’s and the reverb’s wet parameters. As a result, one has a rhythm tone using reduced effect settings when playing below the fifth fret and a more overdriven and effect-laden, lead tone when reaching for frets five and above. The threshold of five is, of course, variable. It was chosen in this case because when playing in A one can easily begin to play a solo at the fifth fret position and above. The test was successful with the rhythm/lead tone switching happening quite reliably and sufficiently fast.

Next, instead of using fixed settings that were being switched either on or off, it was tried to control certain effect parameter settings more fluidly according to the fret number. For instance, the reverb wet knob was set to increase in value as the fret number increases. Consequently, a note played on the first fret had much less reverb than a note played at the 12th fret with the values in between increasing at a steady rate.

With the steady communication between Arduino and Pure Data working, a whole lot of new tonal possibilities was opened, and I am sure that there are a lot more possibilities to discover as far as mapping certain effect parameters to the Arduino data is concerned. This, however, will most probably take place in the third semester during the third phase of the project where suitable effects and playing styles that exploit the two setups’ capabilities will be further explored.

MIDI or something else?

As mentioned in the previous blog post #11, it was initially planned to start using the IMU sensor. However, my supervisor and I decided that my current MIDI sending setup was not cutting it anymore. The problem is that I currently use control change to send MIDI data which is limited to the range 0-127 steps. Consequently, if I want to make a pitch shift for example, one would definitely hear the pitch jumping from step to step instead of having a smooth transition. My supervisor hence recommended sending MIDI using pitchbend values. Instead of 127 steps, a pitchbend message can be in the range 0- 16,383 which means way more steps and smoother transitions. Unfortunately, the current Arduino MIDI (USB) library I was using could not send pitchbend messages. My supervisor and I did some research and the only library that we found that could send pitchbend messages was not USB compatible.

Additionally, the general way in which both setups were transmitting sensor data via the Arduino to the laptop for further use was not ideal. The latency was high with new MIDI data sometimes coming in as slowly as every five to eight seconds according to the MIDI analyzer “MIDI View”. This of course, makes the data practically useable to fluently controlling effect parameters in almost real-time. In an effort to mitigate the issue, it was decided to abandon the idea of using the USB serial port and a MIDI USB library for transmitting the MIDI data. Instead, the idea was to use an actual MIDI cable and a “pure” MIDI library. As a result, I was tasked to go get a MIDI (DIN) jack and wire it to my Arduino so it could send the MIDI messages directly using a MIDI cable and not via the USB cable that connects the Arduino to the laptop.

Consequently, the necessary parts including a MIDI jack were bought. The MIDI jack was soldered and connected via a breadboard to the Arduino and a MIDI cable was used to connect the Arduino/breadboard to the MIDI In jack of a Steinberg audio interface. Additionally, the Arduino sketch was altered to accommodate the new MIDI library and new means of transmitting the MIDI data. Unfortunately, all these efforts were apparently in vain for the MIDI data transmission did not increase in speed. At that point in time, the reason for that was unknown and no explanation was found. With no reliable (and especially fast) way to transmit the senor data for further use in Pure Data, the whole project began to stall since a stable transmission was THE prerequisite for further testing of the attachment device, the sensor position, the Arduino code and the quest to find suitable effects and usage for the setups.

With the final presentation approaching fast, it was decided in June to try a radically different method. During an Internet research session, a YouTube video was discovered that uses serial bus communication to transmit data from an Arduino to Pure Data using the “comport” object in Pure Data. After specifying the baud rate, one can open and close the data stream coming from the Arduino and, using additional objects, one can convert the data stream to the original values sent from the Arduino. Using this method, faster data transmission could be achieved.

Sensor Test & Selection

At this stage of the project, I decided that it is time to determine which sensor will be used for the left, fretting hand setup. In order to find out which sensor in which position works the best, I directly compared the sensors one after the other in different positions and made notes what works and what does not. The good news is that we have a clear winner; the bad news is that there are still some issues remaining.

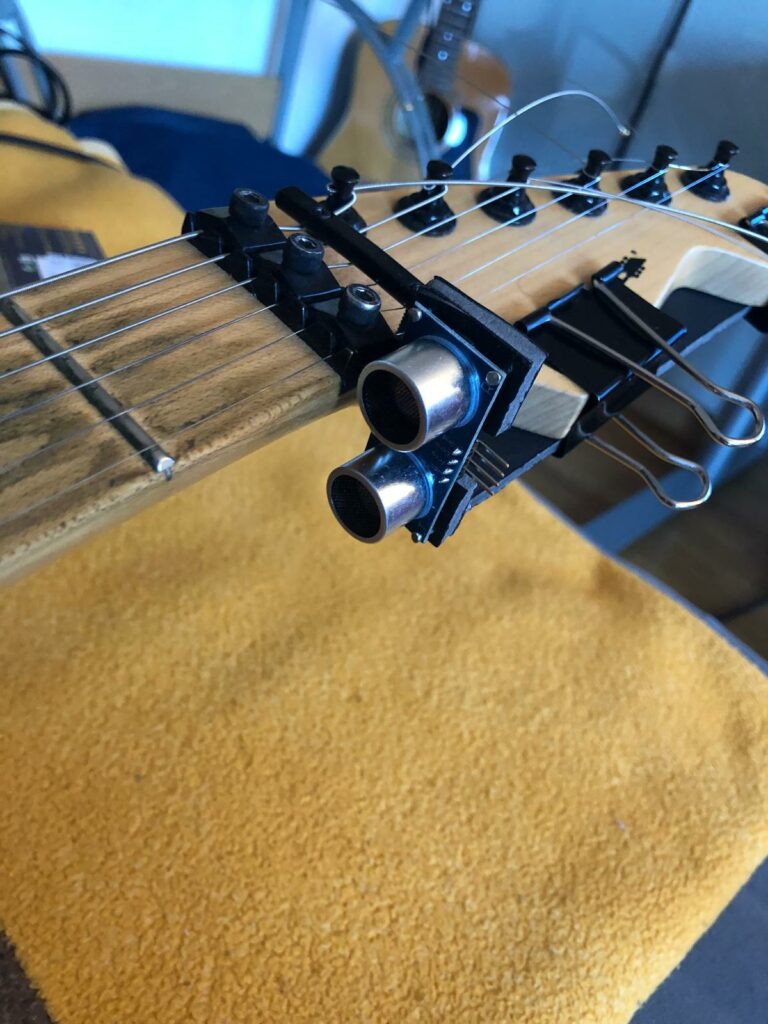
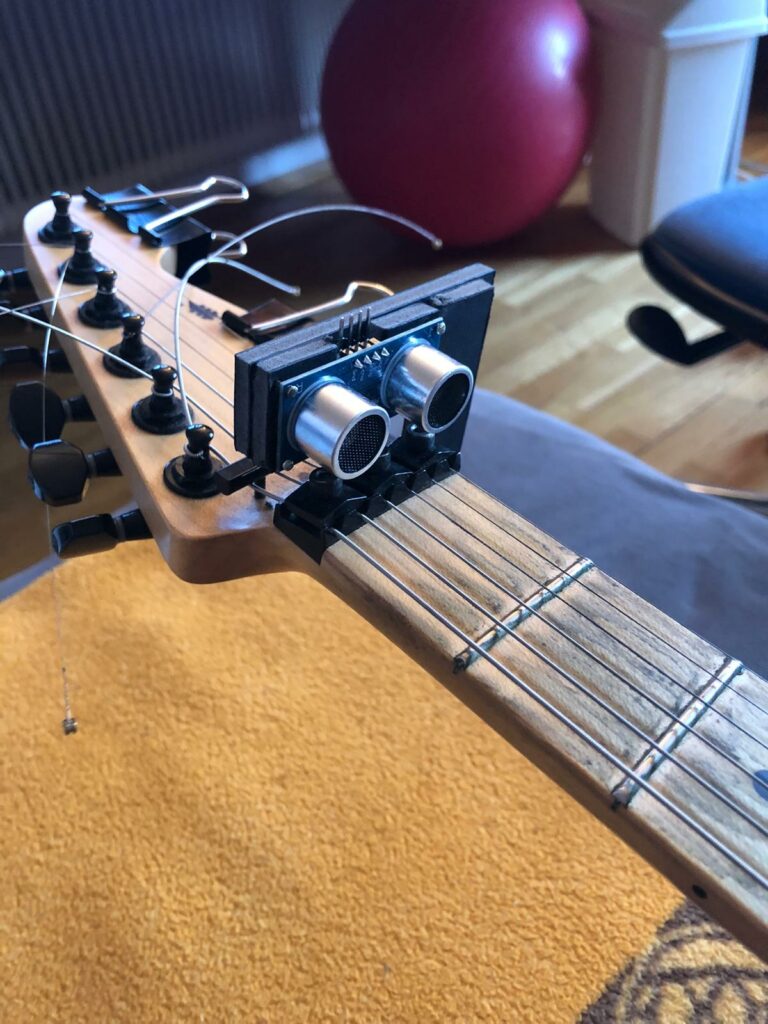
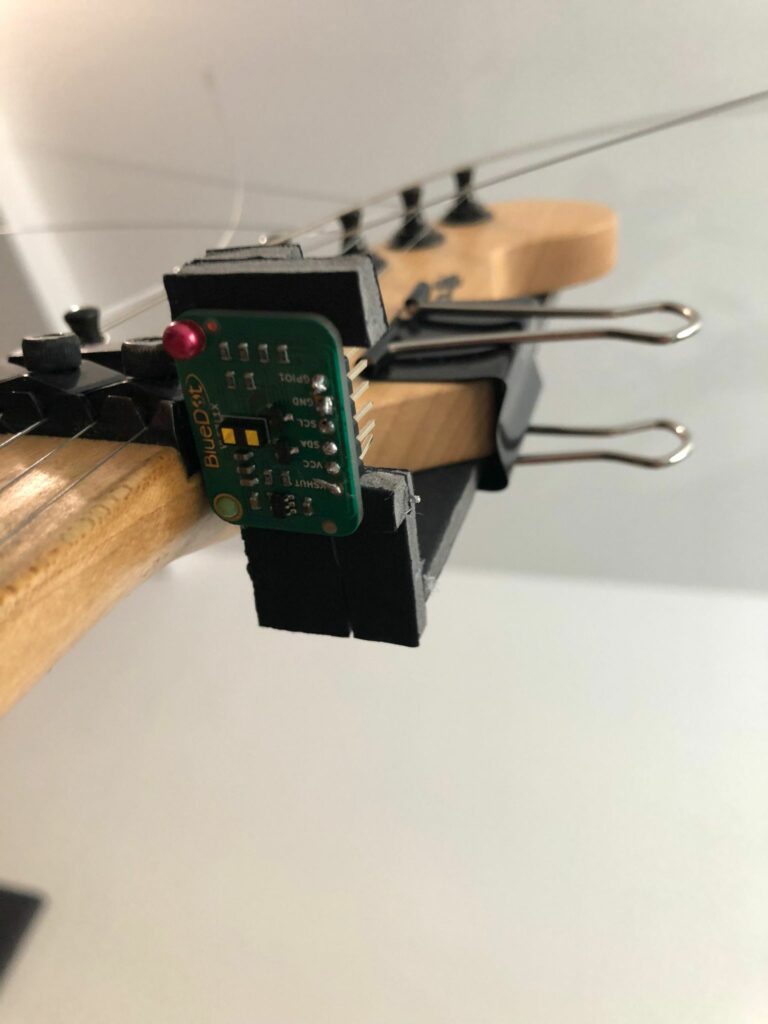
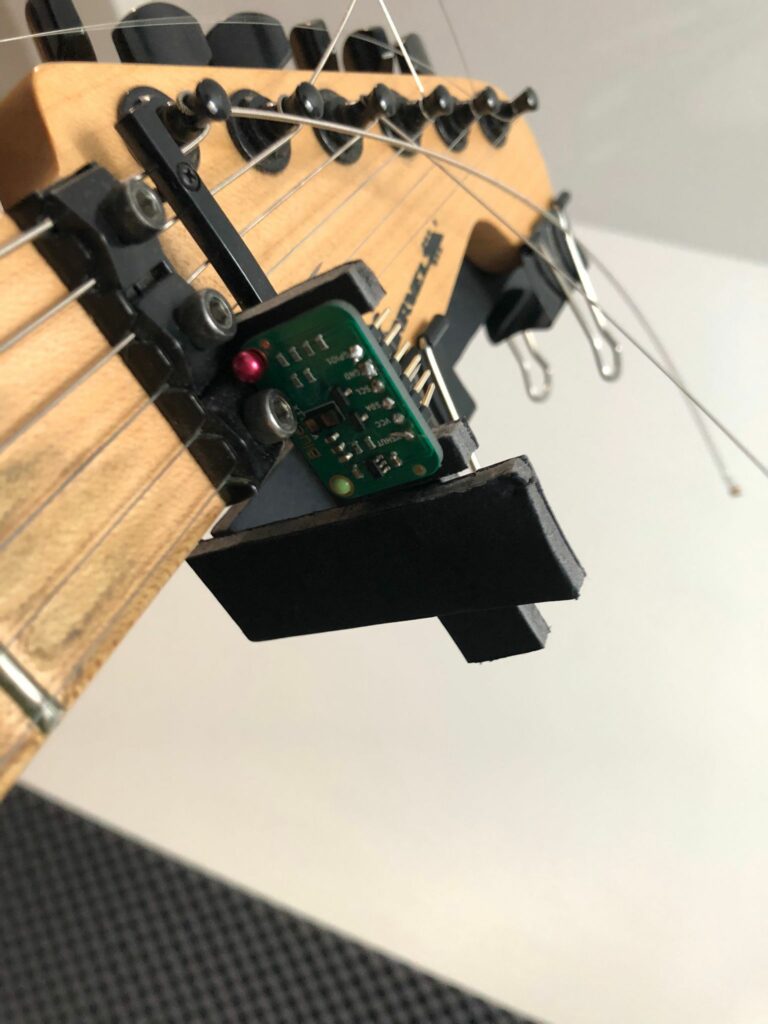
What kind of sensors are tested? I tested the HC-SR04 ultra-sonic sensor against the VL53L1X time-of-flight sensor. Both sensors were tested using two different rigs: Rig #1 is attached to the bottom of the neck and rig #2 is placed horizontally on top of the neck.

I started with the ultra-sonic sensor. Having worked with the time-of-flight sensor for a while now, I was surprised of how bad the results were. As I mentioned a couple of times (most notably in blog post #6), I always had problems with the ultra-sonic sensor as far as accurately pinpointing the fret location if a real hand is used as a reference. In conjuncture with rig #1, the ultra-sonic sensor gives very accurate distance and fret number readings if a flat surface is used as the object whose distance should be elicited. If this object is a hand, however, the readings become very inaccurate. Don’t quote me on this but I think the problem arises because the ultra-sonic sound spreads out a little bit as it travels through the air and, as a result, bounces off of multiple points of the fretting hand which in turn leads to fluctuating readings. Using rig #2, the ultra-sonic sensor did not work at all during the test. Here, the sound apparently bounces off of the frets instead of my hand. Depending on the angle of the sensor it just detects ranges between two to five frets.

Ultra-sonic sensor rig #1
Ultra-sonic sensor rig #2

These sobering results lead me to the time-of-flight sensor which, luckily, fared better than its ultra-sonic relative. No matter what rig, the distance and fret number readings are super exact until fret number eight, and I think with further coding, I can extend the range to the 10th fret at least. I think the issue at hand is that the library I am currently using calculates only integer values. However, since the fret ranges and their lower and upper limits are defined as decimal numbers, the integer numbers may become too inaccurate and unsuitable to calculate the fret numbers after the 7th fret. I have already asked for the advice of my supervisor regarding this matter. Another major concession is that the fret detection works best when playing barre chords. When playing a solo, I am confronted with the problem that the forefinger is always registered to be one fret before actual fret where solo is played. This unfortunately is the result of the usual hand and finger positioning when soloing. Since my goal is to extent the guitar’s range of sounds in a way that is not invasive, I must find a solution that does not require the player to alter his or her hand position…

ToF sensor rig #1
ToF sensor rig #2

Nevertheless, we have a clear winner: the time-of-flight sensor – especially in conjuncture with rig #2. It does not work optimally yet, but I will spend no more time with the ultra-sonic sensor and focus on the ToF. However, as far as learning the code is concerned, my time spent with the ultra-sonic sensor was not in vain. I learnt a lot and I could transfer a lot of code to the ToF.

Here comes the ToF sensor Part 2

Hello and welcome back! We were in the middle of deciding which sensor fits my project best – the VL53L1X or the VL53L0X?

They are pretty similar and both have enough range, however, there is one difference which made me favor the VL53L1X: the possibility to (de-)activate SPADs. The VL53L1X has a 16 x 16 spad array for detection. By default, all spads are enabled. This creates a conical field of view (FoV) covering 27°. By disabling a part of the pads, the cone can be narrowed to 15° at 4 x 4 activated spads and the direction (ROI = Region of Interest) can be specified. The VL53L0X does not offer these options. Considering my problems with detecting the appropriate finger to get the most accurate location of the fretting hand possible, I figured that the possibility to further restrict the region of interest would lead to more accurate results.

Consequently, I bought a VL53L1X on Amazon – it was quite expensive in comparison: I could have bought three VL53L0Xs for the price of one VL53L1X. I was used to having cheaper and more sensors at my disposal (I had five ultra-sonic sensors for example) and I have to admit this put some pressure on me working with the sensor because I had no second (or even) third chance in case I messed it up somehow.

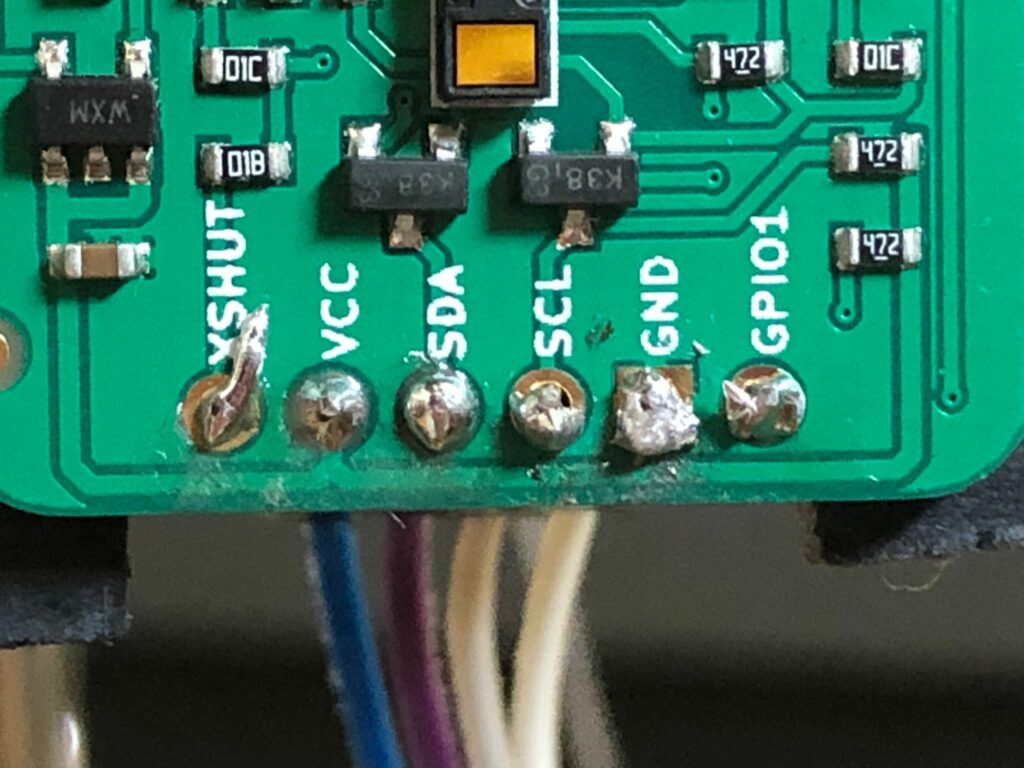
This pressure intensified when I saw that the sensor came without the necessary pins soldered on. I am SO bad at soldering. I once participated in a soldering course as a child where we had to build a radio from a kit, and I just couldn’t get it to work because of my horrible soldering. The short anecdote aside, I had no choice but to try it. The result is quite appalling (even my supervisor said so) but it sort of works. Here is a picture that illustrated my shortcomings:

I now had to built rigs to attach it to my guitar. The design of the rigs is closely based on the rigs already built for the ultra-sonic sensors, using the same material and technique. I first build a rig that places the sensor on the underside of the neck. When trying out the VL53L1X sensor using rig #1, I noticed that when playing a solo my forefinger is placed a little bit before the actual fret it is fretting, and I figured that maybe I need to adjust the sensor in this regard. However, when playing a barre chord for example, the finger position is straight on the correct fret – this could evolve into a real problem.

I decided to build a second rig that places it horizontally on the neck itself in order to see if this position solves this problem. I will keep you updated on the results.

I tried rig #1 with quite good results but still have to try out rig #2. After dropping it for the third time, I also gave in to the pressure of working with one single expensive VL53L1X sensor and bought the three VL53L0X just in case. This project is getting quite expensive, and I wonder if there is a possibility to receive some funds from the KUG or FH…

Here comes the ToF sensor Part 1

The proceedings described in this blog post took place quite some time ago before other projects forced me to put my guitar project on the backburner. I also did not have time to put my advancements into writing – until now. Today is a nice sunny day so I decided to sit on my balcony and write this post which is long due anyway.

Short recap: In my last post I mentioned problems concerning the tackling of finger placing when playing the guitar since Fingers placement on the fretboard is:

  1. Different according to how the guitar is played. The hand and finger position differs for example when Barre chords are played compared to when single notes/a solo is played.
  2. Not like a flat surface (which is ideal for the ultrasonic sensor) but instead quite inconsistent and I think that sometime the sensor does not “know” which finger or other part of the hand is the relevant point from which to measure the distance from.

I had the growing concern that the ultra-sonic sensor is not the right tool to pinpoint the location of the fretting hand along the neck and after consulting with my project supervisor we decided to try our luck with a so-called time-of-flight (or ToF) sensor that measures distance using light not ultra-sonic sound. My supervisor recommended me several types but and I started comparing their specs.

But first of all, what are “time-of-flight” sensors? According to a trusty and very helpful blog called “Wolles Elektronikkiste”, these kinds of sensor work (as the name suggests) with the time-of-flight (ToF) principle. They emit light rays and measure the distance according to time passed until the reflected rays reach the sensor again. This makes them very similar to the ultra-sonic sensor, but they work optically. The rays I mentioned are in fact infrared (IR) rays emitted from a Vertical Cavity Surface-Emitting Laser (VCSEL) which features a wavelength of 940 nanometers (nm) – a wavelength outside the spectrum of visible light. Furthermore, the sensors use so-called Single Photon Avalanche Diodes (SPADs) (this detail will become more useful down the (blog) road).

On my quest to find the ideal ToF sensor, I looked more closely at the VL6180X, the VL53L0X and the very similar VL53L1X.

A quick search verified that the VL6180X is unsuitable for my project because of its limited range of 20 cm. As mentioned in one of my previous blog posts, I am working with a Charvel guitar whose scale length is 64,8 cm with the neck measuring approximately 40 cm so consequently, 20 cm of range is too short.

The next choice between the VL53L0X and the VL53L1X proved to be more difficult, and I have not reached a final decision yet. Again “Wolles Elektronikkiste” provided me with a useful blog comparing these two sensors. They have a lot in common as far as voltage range and pinouts are concerned and the communication is via I2C for both sensors. The article describes the range as the most obvious difference between the VL53L0X and VL53L1X with the first reaching two meters and the latter up to four meters. These two ranges are both more than enough for my applications, so I still had no obvious favorite.

I will insert a cliff hanger here to keep the suspense alive: Which sensor will I choose? Read my next blog to find it out!

Sources:

VL6180X – ToF proximity and ambient light sensor • Wolles Elektronikkiste (wolles-elektronikkiste.de)

VL53L0X and VL53L1X – ToF distance sensors • Wolles Elektronikkiste (wolles-elektronikkiste.de)

My Poster of the Future Journey

On Tuesday this week, one of the major projects of the semester came to an end: the poster of the future. Over the last two weeks this project kept me quite busy, and I had little time for something as complex as my guitar project and related blog posts. To make up for at least one blog post, I decided to dedicate this blog to my poster of the future project-journey.

It all started back in January, still in the first semester. We were tasked to come up with an idea concerning a “poster of the future”, thinking about how a poster could look like in the future and which themes it could possibly address. The finished results would then be presented in an upcoming exhibition in September. The project aimed to foster the interaction between the majors but at first, only the majors Sound Design and Communication Design were involved.

I teamed up with a colleague, who studies Communication Design and we thought about future problems or issues that may arise in the future. We did not want to go with obvious choices such as climate change or too much screen time (which would have been the easier and better (?) choices in retrospect). After some time (and partly inspired by me watching Blade Runner 2049), we came up with the topic of advanced, intelligent robots and how they will be treated in the future – will the be enslaved or used for work deemed unworthy for humans? In terms of poster and sound, we wanted to show a human hand that was a robot’s underneath, accompanied by sound that changed from analog to digital sounds and instruments.

With this idea, we started into the second semester where the whole project and its importance were blown up immensely. Suddenly, all majors were to take part and every student should not only do his or her own project but in addition had to partner up with another student and help him or her out.

Furthermore, the second semester also marked the beginning of my colleague and me erring from project presentation to project presentation, desperately trying to come up with a consistent concept that satisfied the demands of our two main lecturers. At first, we were pretty happy with the idea but the lecturer responsible for Communication Design changed from the first to second semester and our idea had to change as well.

We followed the suggestion of the COD lecturer to pursue the concept of eroticism and how it might be perceived in the future. We had several ideas that were rejected sooner or later because they did not fill the teachers’ expectations. Finally, we stumbled onto the term of erobotics, describing the possibility of intimate human-robot relationships in the future. We clung to that topic and (with the help of the SD lecturer) came up with the idea of three people telling their friends about their intimate experience with a robot. To ensure the authenticity of the narrations, we hired three to-be actors that I knew from a film project we did during the first semester. The actors proved to be quite costly, but they did a great job and at the end of the day I had three authentic tales to work with. In the meantime, my colleague had to let go of illustrations and was told by her lecturer to use photos instead. She photographed close-ups from machines, and I installed a mechanism that allowed for triggering the actors’ stories by touching the photos.

The last hurdle was to come up with a sound design concept underlining the actors’ recordings. I was already pretty happy with the recordings and with the messages they conveyed so I had a hard time coming up with additional sound design just for the sake of it. My lecturer suggested using abstract sounds. The thing is I cannot relate to abstract design – visual and auditory. I never stood before an abstract painting and was overwhelmed with emotions. However, I saw my fair share of realistic paintings all over Europe and was always in awe. Maybe it is because I do not understand it, but I just cannot relate to abstract art and am never impressed by it.

But here we go. I recorded some ASMR sounds that admittedly turned out pretty good. However, I tried to go for something realistic for one more time and modeled acoustic backgrounds that placed the three actors in three different but plausible environments where they would tell their stories in real life as well. However, I was then again remined that the abstract way is the right way, and I changed the whole thing again and came up with an abstract concept I could halfway relate to. By then, I was already hoping that our poster would not be chosen for the exhibition.

Not counting a one-hour-delay, the final presentation went quite well with the touch function working like a charm.

I am now glad that the project is over. Although it was a real struggle, I am reasonably happy with the results, and I think that we did our best. I do not see my future in sound installations and exhibitions so I will not be extraordinarily sad if our project does not get chosen. In retrospective, we should have decided on something more straightforward than erobotics and it would have saved us some nerves. Additionally, I have to say that I would have wished for more acceptance of our own ideas. Somewhere in the middle of the project I began thinking about what kind of sound design would please my lecturers instead of thinking what kind of sound design I would like our poster to have.

However, I also have to mention that I really enjoyed doing the sound design for another student’s project. It involved composing four songs of four different genres (jazz, rock, retro pop, classical) and this is where I feel truly comfortable.

Establishing ranges and sensor type musings

With the correct formula identified, I started to work on the Arduino implementation. As outlined in Blog #5, my first sketch could only compute the right fret number after manually inputting the corresponding distances. The next task was thus, to make a sketch that allows the setup to read the distance and then automatically output the correct fret number. As the hand is always nearer to the sensor than the fret, I determined that certain fret ranges must be defined. Arduino then must be able to recognize which distances coming from the sensor fall into which fret range and then output the correct fret. From my Excel calculations sheet (and in retrospective just from looking at the guitar), I noticed that the fret deltas (the difference between the distance to fret n and the distance to fret n+1) gradually decrease and that this decrease corresponds to the width of the fret. Since my fingers are always between the area of two frets, I can define a range of a fret with the upper value being the fret distance of fret n and the lower value being the fret distance of fret n-1.

Following this principle, I defined the following fret ranges:

Fret numberRange lower limit [cm]Range upper limit [cm]
0  
10,003,64
23,647,07
37,0710,31
410,3113,37
513,3716,25
616,2518,98
718,9821,55
821,5523,98
923,9826,27
1026,2728,43
1128,4330,47
1230,4732,40
1332,4034,22
1434,2235,93
1535,9337,55
1637,5539,08
1739,0840,53
1840,5341,89
1941,8943,18
2043,1844,39
2144,3945,53
2245,5346,62

I then implemented these ranges in my Arduino code using the if() function.

I then put the code to the test, and it works as planned – at least when using a flat surface (in my case a ruler) to act as the object whose distance is measured. Unfortunately, it does not work that well or consistently with my actual hand playing the guitar. Fingers placement on the fretboard is

  1. Different according to how the guitar is played. The hand and finger position differs for example when Barre chords are played compared to when single notes/a solo is played.
  2. Not like a flat surface (which is ideal for the ultrasonic sensor) but instead quite inconsistent and I think that sometime the sensor does not “know” which finger or other part of the hand is the relevant point from which to measure the distance from.

I decided to tackle this problem by firstly improving the rig that secures the ultrasonic sensor to the guitar neck/headstock figuring that my first version was too instable and placing the sensor in a non-optimal position. I therefore bought a hot glue gun and went to my mum and her cellar containing other tools and material. With these combined powers at my hands, I crafted two rigs that constitute a definite improvement over my first version as far as stability is concerned. The first rig places the sensor below the fret and the other rig places the sensor right on the fretboard itself.

Rig 1

Rig 2

The first rig however, gives similarly inconsistent results as the very first version. The second version looks more promising, but I am currently dealing with a reflection issue with the ultrasonic beam being reflected too early from the frets.

Unfortunately, this problem is reoccurring no matter what rig I try, and I cannot seem to get on top of it. I am thinking about changing the type of sensor from ultrasonic to time-of-flight sensor functions optically, measuring the distance using time and light. Another possibility would also be to use more than one sensor and combine the measurements to obtain a more accurate overall measurement.

Figuring out the fretboard scale

One of the next tasks I tackled was figuring out the scale of the fretboard. What do I mean by that? At first, I had the ultrasonic sensor measure the distance in a straightforward, linear way. However, the frets on a guitar neck become progressively smaller and, accordingly, the linear scale progressively more inaccurate. For my product, it would be great, if the sensor would not output the absolute distance but the actual fret of the current hand position. The first step in achieving this goal was to establish the mathematical relationship of the distances between the frets. Luckily, I found a YouTube video series that thoroughly explained the issue.

Apparently, the basis of it all is the (Western) chromatic scale and the 12-tone-equal temperament. The chromatic scale is a musical scale with twelve pitches, each a semitone, also known as a half-step, above or below its adjacent pitches. The 12-tone equal temperament on the other hand is the musical system that divides the octave into 12 parts, all of which are equally tempered (equally spaced) on a logarithmic scale, with a ratio equal to the 12th root of 2 (12√2 ≈ 1.05946). That resulting smallest interval, 1⁄12 the width of an octave, is called a semitone or half step.

As a result, in 12-tone equal temperament (the most common tuning in Western music), the chromatic scale covers all 12 of the available pitches.

After watching the video and making some experimental calculations, I came up with the following: The resulting formula to calculate the current length of the guitar length depending on the fret is as follows:

k = fret

Lk = string length at fret k

L0 = scale length

Using this formula, I then calculated the fret positions for my Charvel with a scale length of 648 mm or 64.8 cm on an Excel sheet. I double-checked the calculations by manually measuring several fret distances and compared them with the calculated ones – the math seems to be correct. As this formula gives me the string length AFTER the finger so from the finger/fret all the way to the bridge of the guitar, I subtracted the total scale length of 64.8 cm to get the distance from the sensor at the headstock to the hand.

I quickly realized however, that I needed the formula the other way round so to speak – I had to express the fret k depending on the distance measured. Consequently, I used all my summoned all my mathematical skills to transform the formula accordingly. I came up with:

k = fret

Dk = distance from finger to fret

L0 = scale length

Now I had (or still have) to find a way to implement this formula in my Arduino code and find out how to use it in the best way. Firstly, I had to find out another way to get distance measurements from the ultrasonic sensor because I used a library that only outputted integer values. However, the fret distances are not integer numbers at all so I used another way of programming the ultrasonic sensor, so it sends floating point values. With that done, I had to find a way to implement the formula in Arduino. Arduino knows the log function only (the logarithm with base 10) but my supervisor gave me the following formula to transform the base of my current formula (2 to the power of ½) to two log 10:

k = fret

Dk = distance from finger to fret

L0 = scale length

I then started a new, separate sketch to try out the formula and it works! I can input a certain distance and it returns me the corresponding fret.

However, I still have some issues to solve:

  1. The hand is always nearer to the sensor than the fret, so I need to establish certain fret ranges.
  2. Arduino then must be able to recognize which distances coming from the sensor fall into which fret range and then output the correct fret.  
  3. It would be cool if one could calibrate the sensor by first giving him the distance of the first fret and then the 12th and it calculates the frets in between based on the above-mentioned formula. That way, the fret detection mechanism would be flexible and adaptable to each guitar scale length.

Sources:

Math of the Guitar Fretboard (Part 1) – YouTube

As well as the following parts

Chromatic scale – Wikipedia

12 equal temperament – Wikipedia