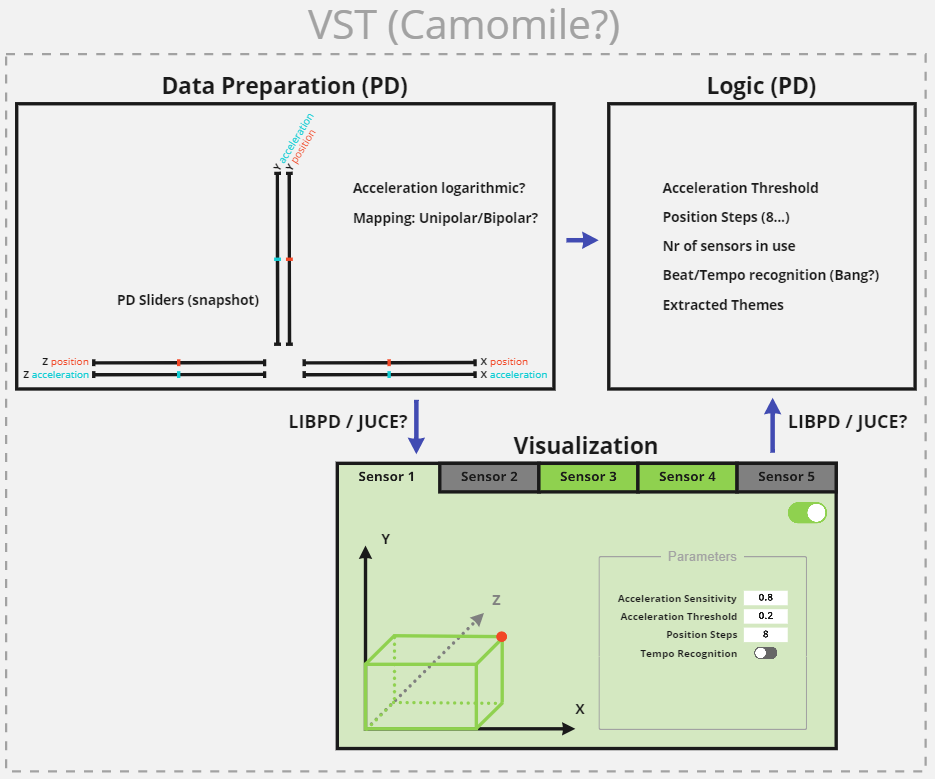
From a sensor movement to a change in the soundscape, it takes quite a number of steps. To make the process and my tasks for building a prototype a little more tangible I created a small sketch that includes some signal flow descriptions and other details that lay out the logical sequence of the interactive capabilities of this project. I will use this blog entry to display and explain the aforementioned sketch.
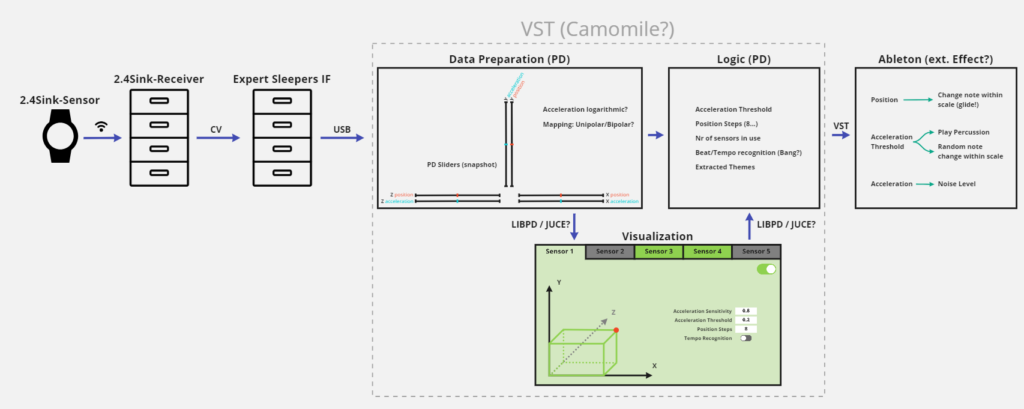
In the picture above you can see the outlines of the whole sketch, but for better readability, I will present the separate parts individually below. The signal flow starts with the wristband sensors and ends with Ableton – the DAW that I will use in Live-mode to play and modulate the interactive soundscape. The signal of course does not stop there, but rather continues until it reaches the speakers. But I would like to point out the separation of the control signal (which is represented in the whole sketch above) and the audio signal, which will be synthesized or played within Ableton. The control signal will be used to modulate or trigger the audio signal, as explained in the last part of this sketch.
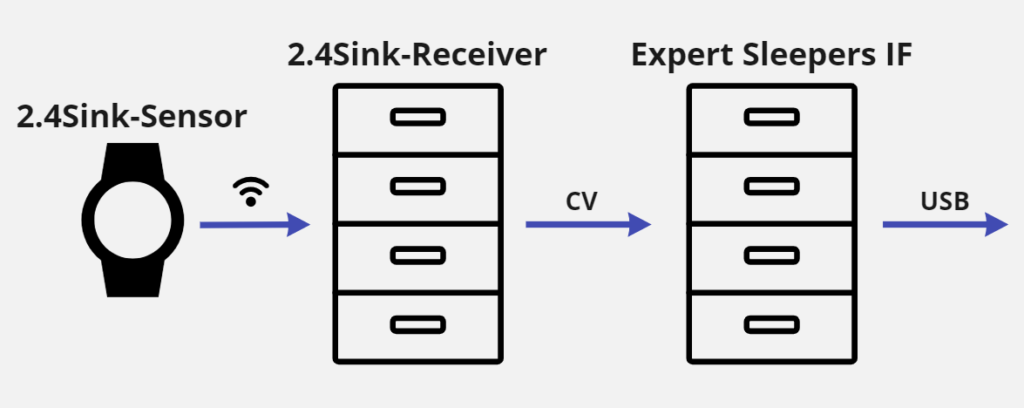
Hardware Flow
The sketch below shows in a simplified manner what I described in my last entry (#11 | First Tests) already: The sensors are wirelessly connected to the 2.4Sink receiver, which is connected via control voltage (3.5mm patch cables) to the Expert Sleepers USB audio interface, which in turn is connected via USB to my laptop, running Pure Data. And that’s already everything there is to say here for the moment.
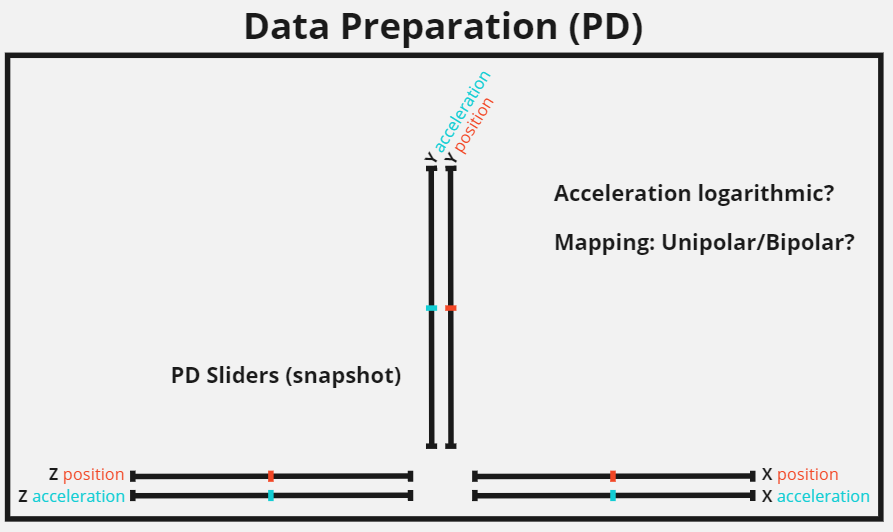
Data Preparation
The data preparation in fact includes a little more than displayed on this sketch (some math mainly) but I chose this view because that is how I will visualize the input values in my PD (Pure Data) patch. Those are the six values I will receive per sensor, position and acceleration on three axes. I will still figure out the best ways to work with the received data (e.g. is a logarithmic representation of the acceleration data more meaningful for my application?).
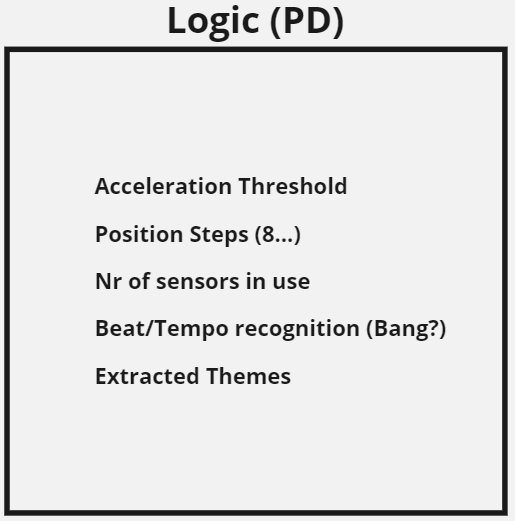
Logic
The logic part (in PD) will extract contextually useful variables from the continuous flow of sensor data. The acceleration threshold, for example, is just a binary threshold variable that is triggered when the acceleration hits a certain threshold. The position steps are merely a translation of the continuous sensor values into integer steps (which are for example useful for playing midi notes on a scale).
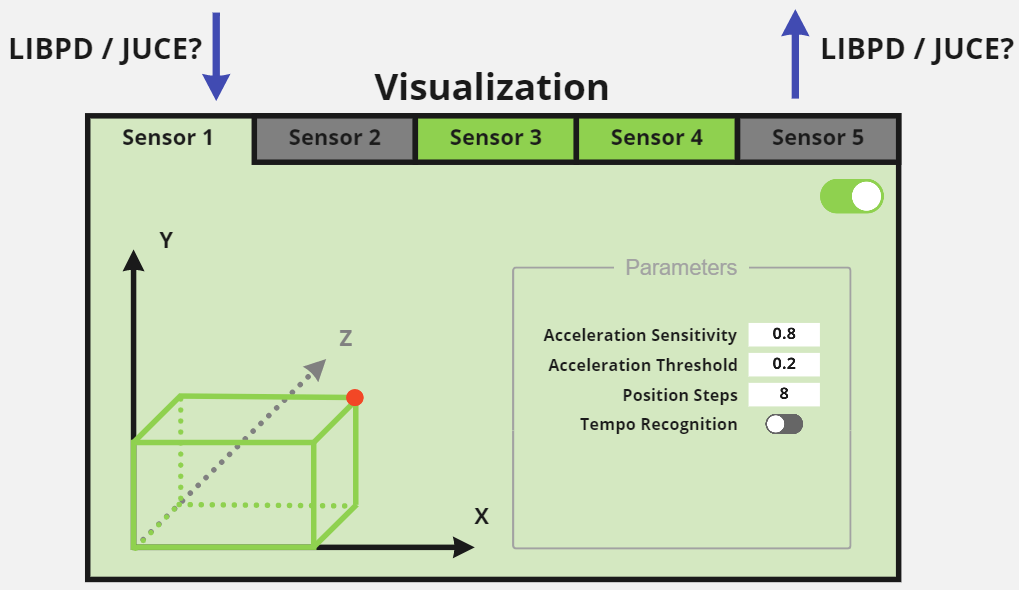
Visualization
The visualization should provide an easy and future proof way to tweak and adjust some sensitivity or threshold values, or also switch on and off sensor functionality during the installation. The goal is to make this a user friendly control room for the whole interactive and generative aspect of the project, so this visualization will definitely still grow in functionality in future.
I am not sure yet what package I will use to create the GUI but the JUCE framework seems to be a good choice. I will evaluate this rather soon.
VST
To be able to interface Ableton, all functionality in Pure Data that was mentioned above (including the visualization) has to be packed into a VST (Virtual Studio Technology). Usually VST’s are created in C++, however, there are some frameworks (like Camomile) that allow me to create a VST from a Pure Data patch, too. This VST will then become a standalone application that is executable and interfaceable from inside Ableton.
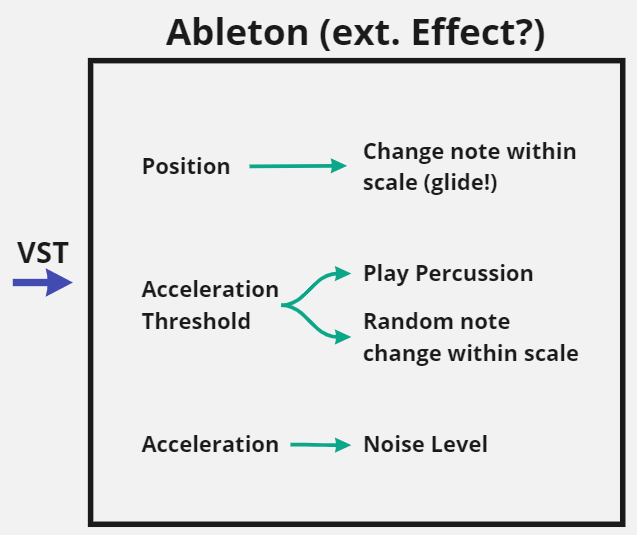
Ableton
Within Ableton, I still have to figure out the best way to work with the variables I receive from the VST, but I suppose it will come down to the VST being used as an external effect. This will allow me to use the variables to achieve modulations like:
- Changing notes depending on the position (or rather angle) of the watch, using the step variable
- Playing percussive samples triggered by the acceleration threshold
- Changing notes randomly within a scale triggered by the acceleration threshold
- Introducing noise in an instrument (e.g. pad/keys) correlational to the acceleration value
Now that the outline for all this stands, it counts to sharpen and execute the planned steps. My next posts will partly follow this line of work, but furthermore also be dedicated to a conceptual/artistic challenge that I am currently occupied with.